AI Scientific Diagram Maker
Make publication-ready diagrams from methods sections, experiment notes, system descriptions, and pathway ideas. Paper Banana is a scientific diagram maker for researchers who need readable labels, logical arrows, editable SVG structure, and Pro visual polish without starting from a blank slide.
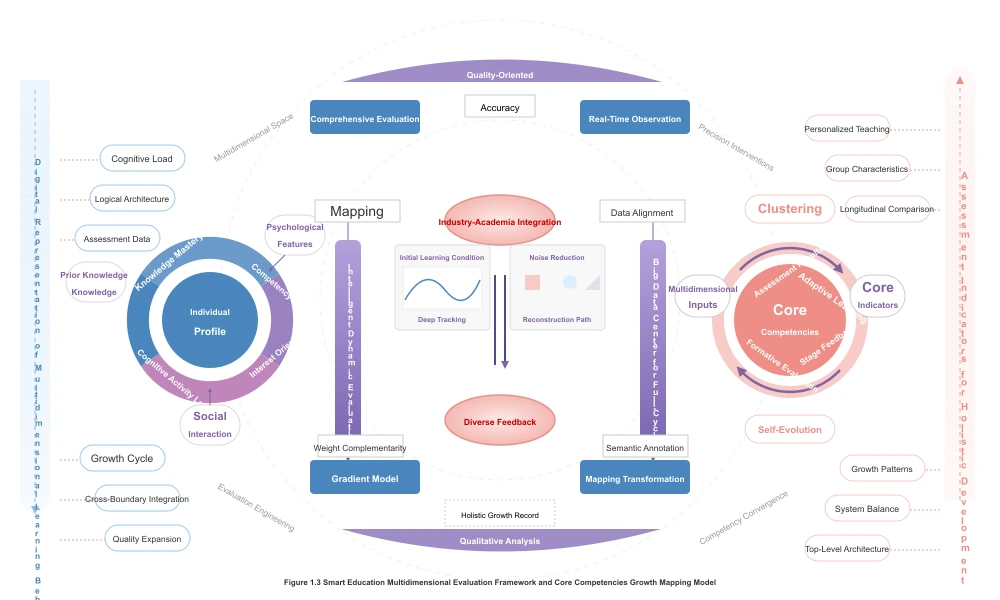
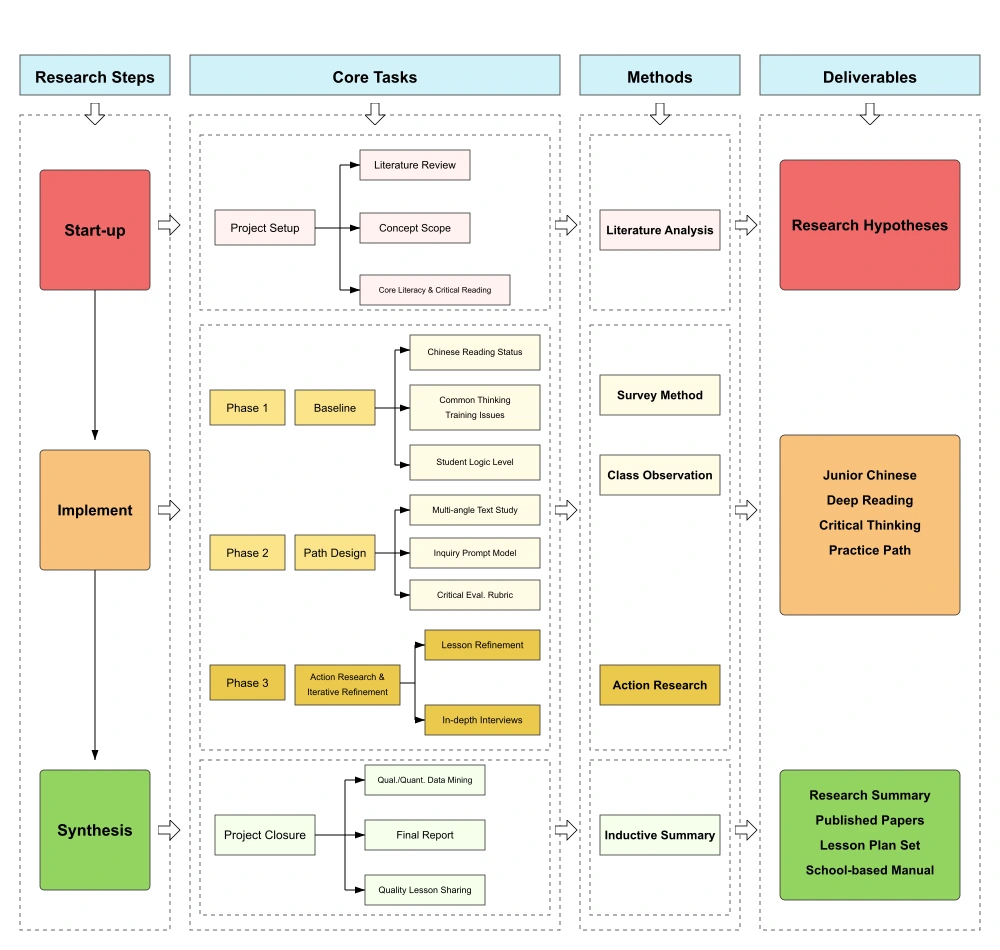
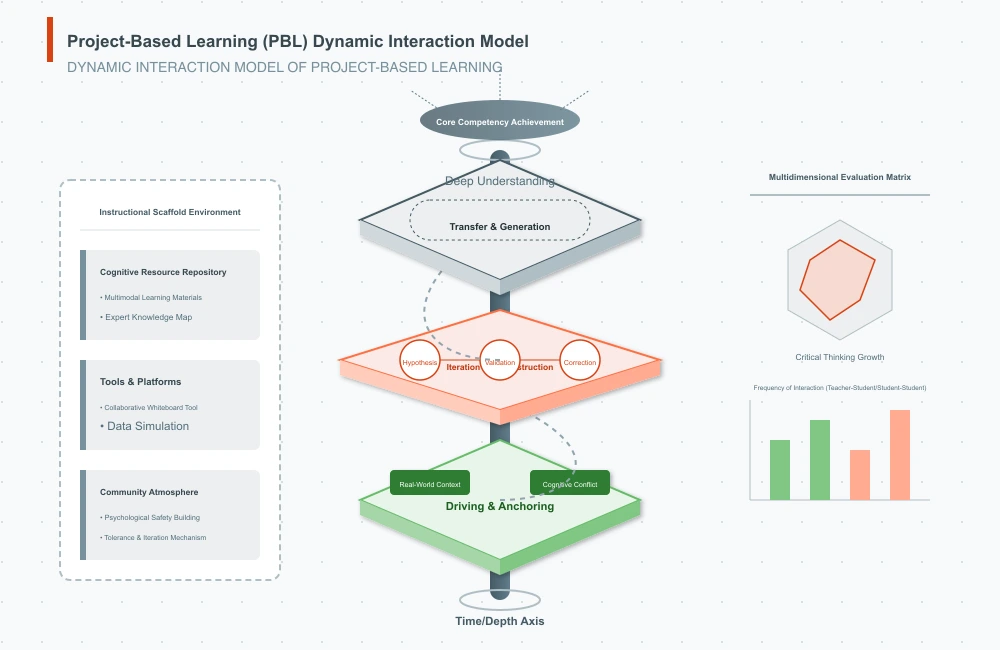
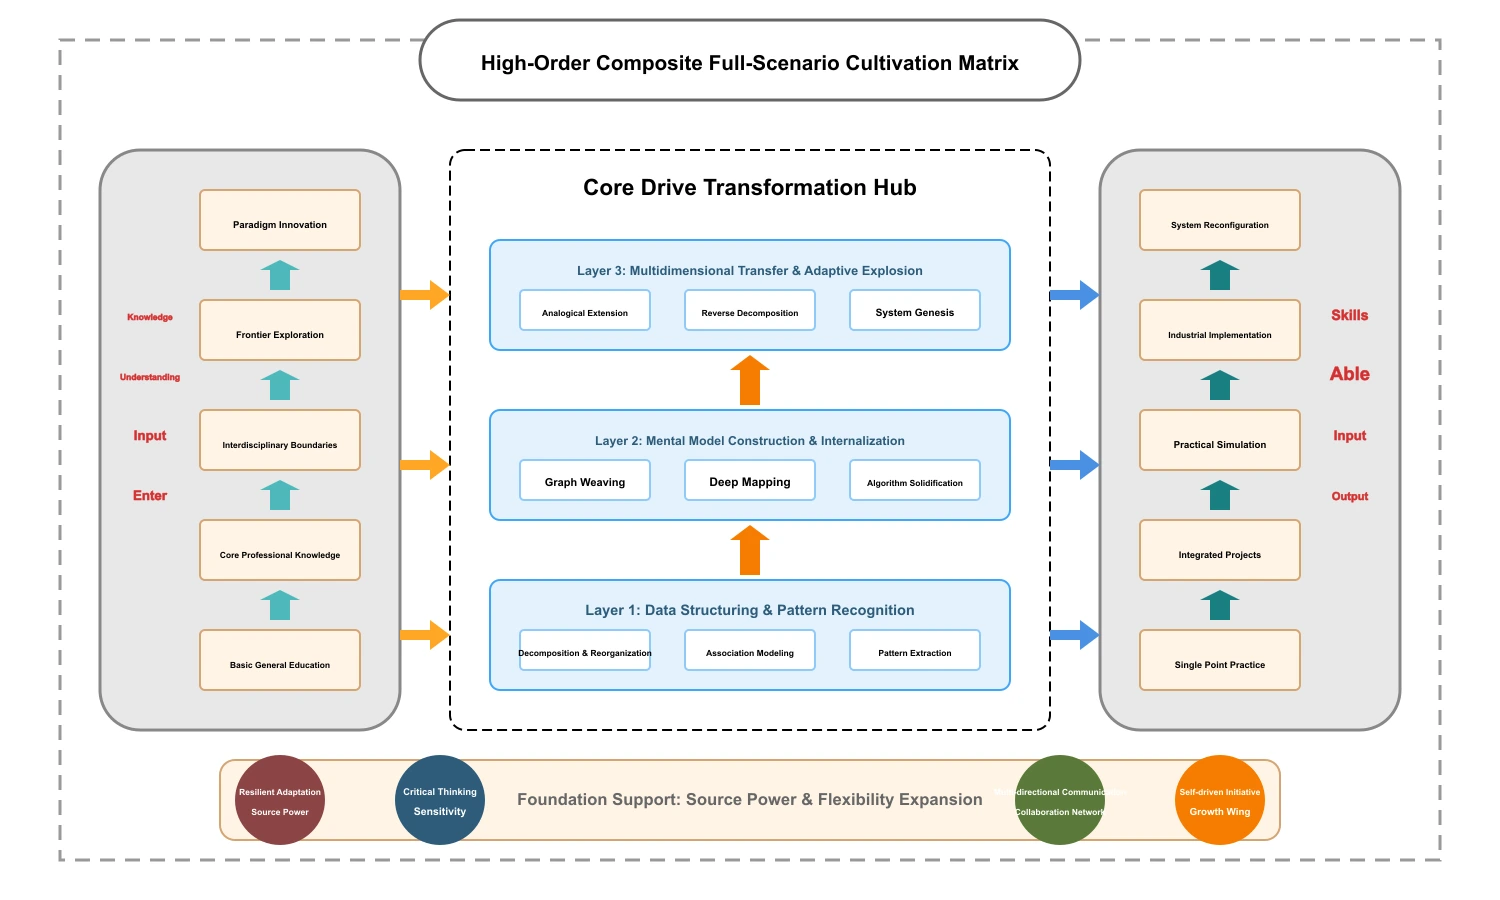
Slide-ready process and evaluation flow layouts.
What Is a Scientific Diagram Maker?
A scientific diagram maker helps researchers turn complex processes into visual explanations: experimental workflows, mechanism schematics, pathway maps, system architectures, and methods figures. Paper Banana focuses on structure first. It extracts entities, relationships, and flow from your text, then builds a clean diagram that can be inspected, downloaded, and improved.
From Paper Text to Structured Diagram
Paste a methods paragraph, abstract, figure caption, or workflow note. The scientific diagram maker identifies the main steps, groups related stages, and draws arrows that reflect your research logic. Use it for methods figures, thesis diagrams, grant proposals, lab protocols, and conference slides.
Made for Research, Not Generic Flowcharts
General diagram tools make you drag boxes and choose arrowheads manually. Paper Banana is an AI scientific diagram maker that understands research language: sample preparation, model architecture, pathway activation, inhibition, validation, analysis stages, and figure-ready labels.
Scientific Diagram Maker Features for Real Research Workflows
Create the diagrams researchers need for papers, posters, lectures, grant proposals, and lab communication.
Experimental Workflow Diagrams
Build workflow diagrams for sample collection, preparation, instrumentation, analysis, validation, and reporting. The scientific diagram maker keeps each step short and readable.
Methodology and Pipeline Figures
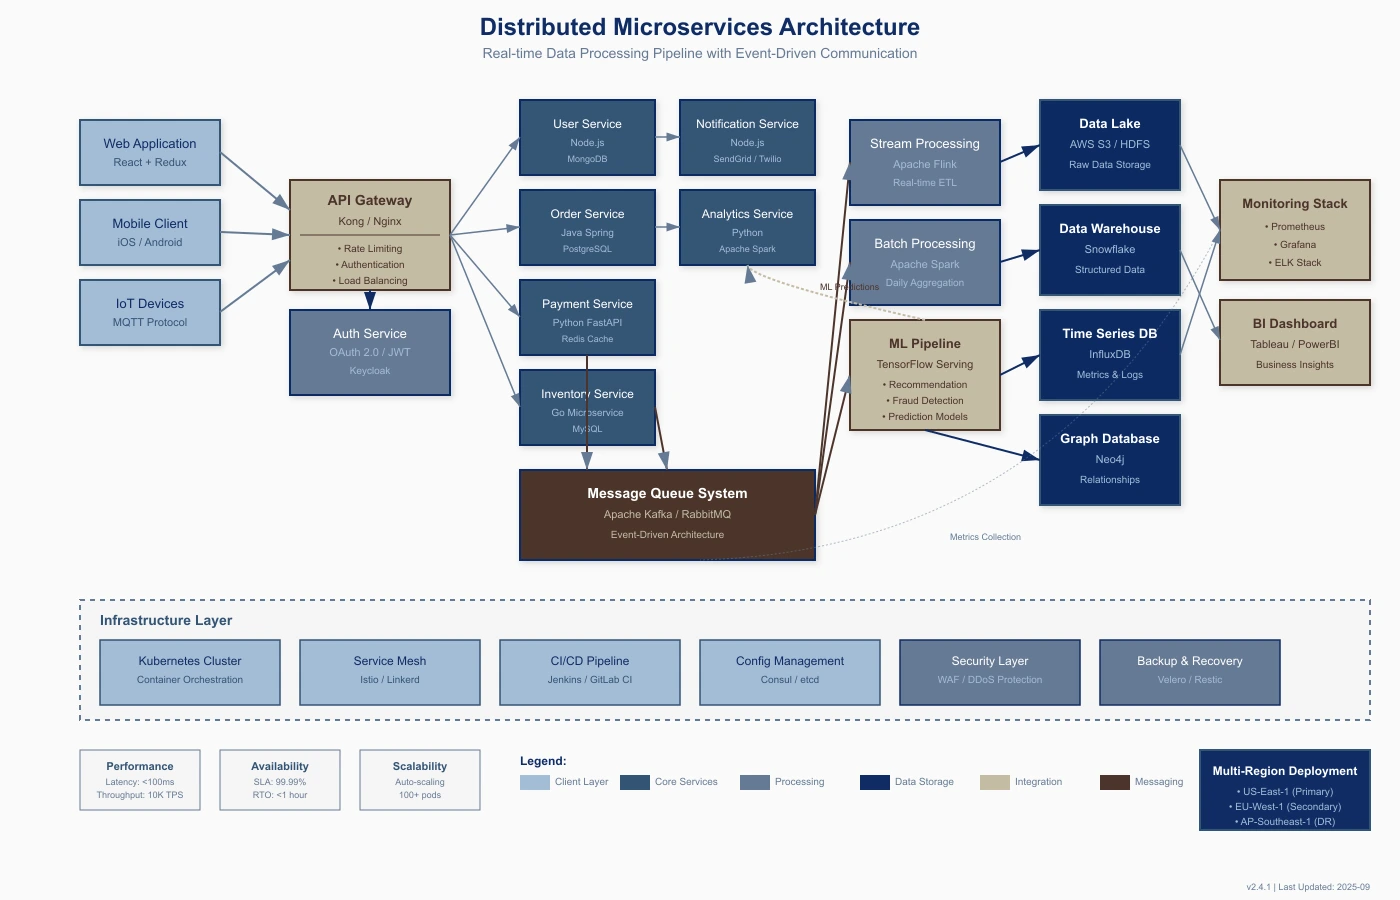
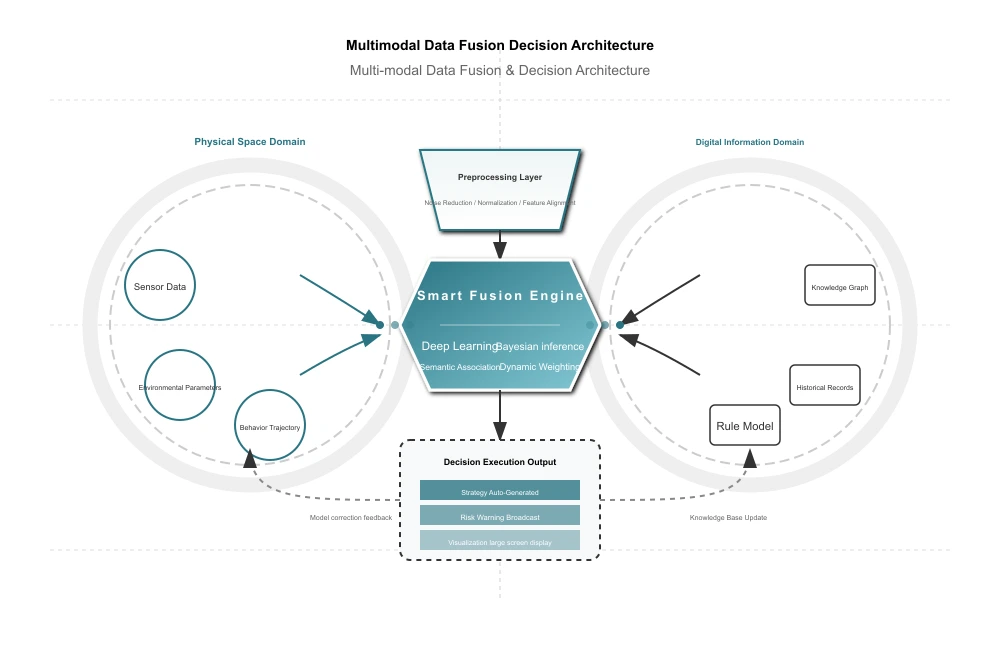
Generate methodology diagrams for AI systems, engineering pipelines, computational biology workflows, data processing, model training, and evaluation.
Mechanism and Pathway Schematics
Create pathway diagrams, mechanism figures, activation chains, inhibition points, and causal relationships for signaling pathways, reaction flows, and process schematics.
Editable SVG Output
Download structure diagrams as SVG so you can rename labels, adjust colors, or refine the figure in Illustrator, Figma, Inkscape, or PowerPoint.
Publication-Ready Enhancement
Use Pro enhancement for cleaner typography, balanced spacing, polished colors, and academic visual style for papers, posters, and slides.
Research-Specific Templates
Start with prompts for RNA-seq workflows, RAG architectures, signaling pathways, PCR setups, transformer models, experimental apparatus, and validation pipelines.
Why Choose Paper Banana as Your Scientific Diagram Maker?
Researchers need accuracy, editability, and speed. Paper Banana is designed around those needs.
How to Create a Scientific Diagram in Three Steps
Use Paper Banana when you need a fast draft, editable SVG, or polished figure for academic communication.
Describe the Research Flow
Paste your methods section, outline the process, or describe the system you want to explain. Mention steps, inputs, outputs, branches, feedback loops, labels, and relationships.
Generate the Structure
Choose a diagram type and generate a free SVG structure. Review the layout, labels, and arrows. Adjust the prompt and regenerate until the logic is right.
Download or Enhance
Download the editable SVG, or use Pro enhancement for a polished academic visual. Export your diagram for papers, posters, slides, grants, protocols, or teaching materials.
Scientific Diagram Maker FAQ
Common questions from researchers creating scientific diagrams.
Create Your First Scientific Diagram Free
Use Paper Banana as your scientific diagram maker for the next methods figure, pathway schematic, system architecture, or workflow diagram. Start with a free editable SVG, then polish the result.